

Leer en Español
If we have chatted for more than ten minutes, you’ve probably heard me mention PlantUML once or twice :). And it is because PlantUML is one of the most versatile tools that I have found in my life. It doesn’t matter if I’m programming in C++, NodeJS, Flutter, Helm, Terraform, or even creating an API with swagger, PlantUML is somewhere out there helping me document. One of PlantUML’s biggest advantages is its ability to create diagrams with textual instructions, and consequently versionable. That is, I don’t have to change my programmer’s hat and put on an artist’s hat to create the graphs and diagrams that will accompany my code, but rather they are created at the same time, and they stay fresh through all the evolutions of the code.
| Code in PlantUML | Results |
@startuml | |
@startuml |
I even use it to illustrate my theology courses at the University, or the sermons in the church.
@startuml |
Also, almost all markdown systems have built-in template support, or it’s available with a plugin. For example,
| markdown | resultado en HTML |
# Sequence Diagram | Sequence DiagramExampleAdvantages
|
Although there is a lot of value in using PlantUML as a documentation tool during application development, it becomes invaluable when we use it to generate dynamic diagrams based on the single-source-of-truth. When we want to know the architecture of our application, it is not as important to know how the developer designed it, but how it is in reality. For different reasons the current architecture of our application may be different from its original intention, for example, the developer made a change and forgot to update the document, or in an emergency, someone made a change directly in production. It is therefore important to have the ability to see the current state of the application. The following diagram is an example of how a graph can be generated dynamically based on real data.
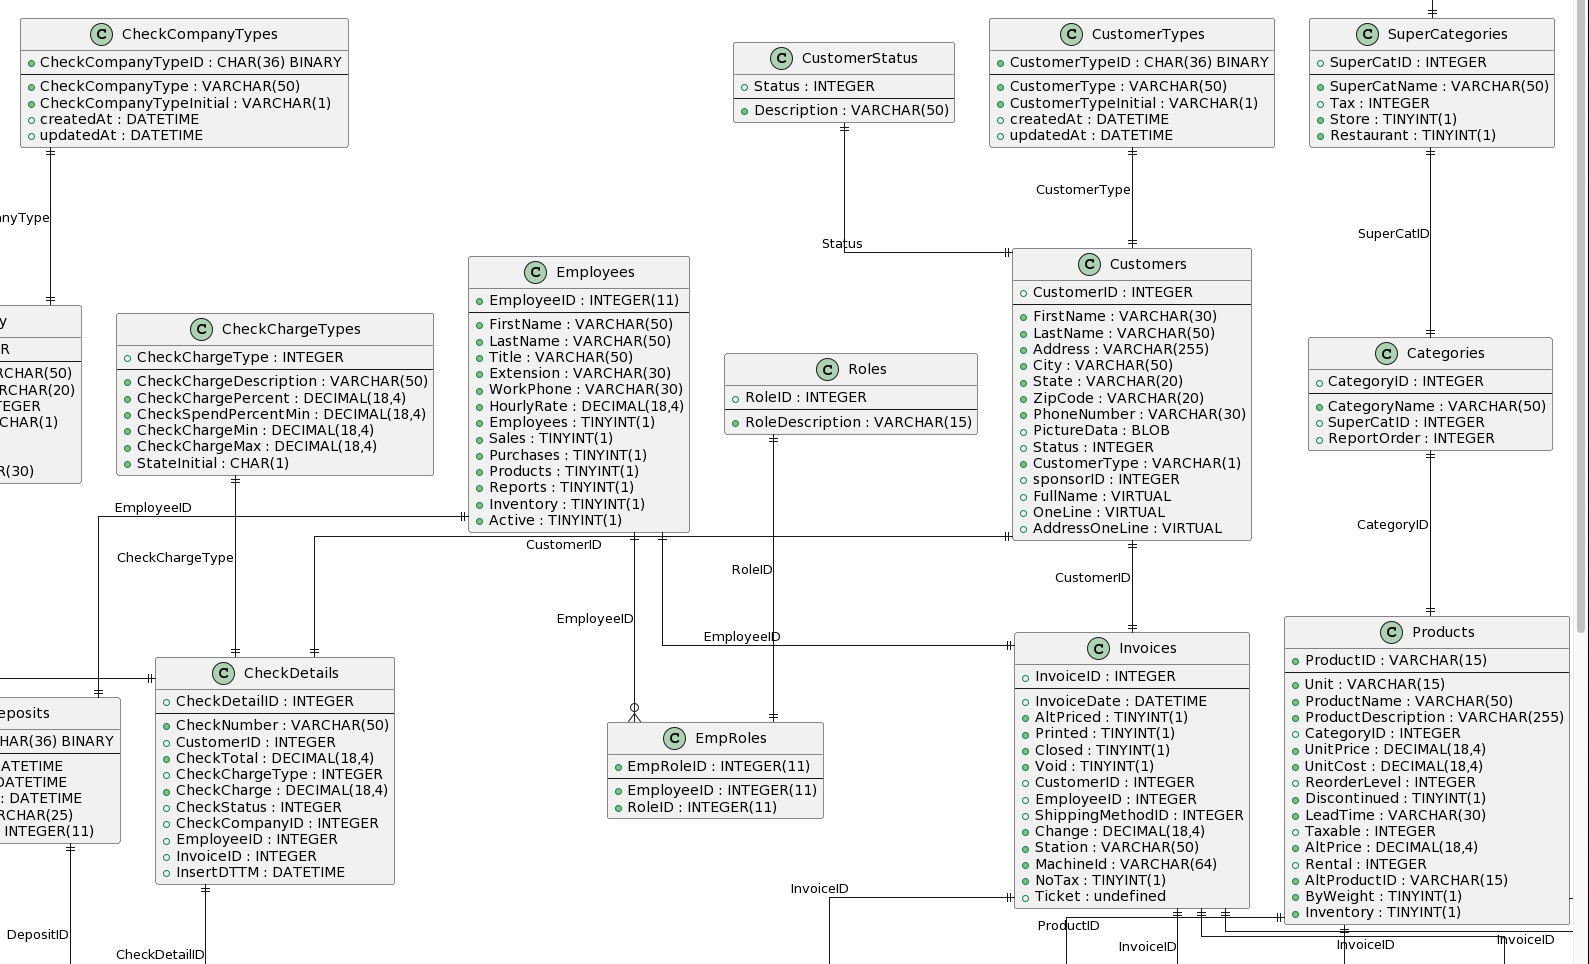
Here is another example, I have a utility that automatically generates a graph of my database schema every time I make a change to the code, so the graph is always up to date:
It is not perfect
Artistic drawings
However, there are some other areas of life where I would like to have a tool like PlantUML, for which PlantUML is not always the best fit. For example, I stopped using PowerPoint a long time ago because of the insistence of Microsoft, and all its competitors, on using closed formats, incompatible with modern version systems [1]. Instead I use marp which allows me to use markdown, and not only it produces the cleanest and most consistent presentations I’ve ever created, but all the content from all the presentations I’ve made over the years fits in one tiny git repository. Although it is possible to use PlantUML to illustrate some of my slides, there are times when I would like to be able to create illustrations like those of SmartArt (TM), but with the simplicity of PlantUML.
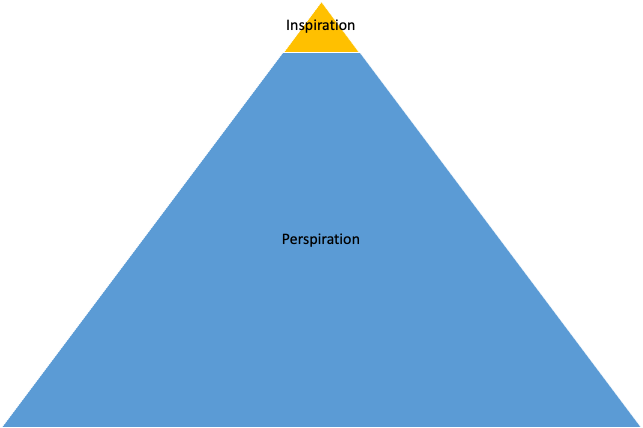
For example, it took me about 30 seconds to make this chart in PowerPoint. I clicked “Insert SmartArt”, then chose the pyramid, deleted one of the levels, wrote the two words, and changed the size of the upper triangle to be much smaller than the other, and voila:
Someone (maybe me when I have some free time), could design a system similar to PlantUML (or augment it) so that something similar can be done and maintain a list of pre-made art that can be easily adapted by the user:
@startart
type=piramide
style=flat
elements=[
  {size:10%,color:yellow,label:Inspiration}
  {size:90%,color:blue,label:Perspiration}
]
@endart
Users
Creating graphics in PlantUML is very simple, and as much as all its fans insist that it is way easier to use than having to draw with the mouse, or drag arrows on the screen, some people will never adopt it. It seems that to be in the group that loves to create graphics based on text instructions, you need to have a developer mindset. Although it is very easy for anyone who writes code, even for novice developers, for others it is a strange and alien practice.
Audience
As far as consumers are concerned, PlantUML’s graphics are not “pixel perfect”, in other words, don’t expect graphics that you can use to make a presentation to your CEO. PlantUML’s emphasis is the ability to create graphics automatically, based on text instructions, and thus the engine decides where to place the different objects on the screen. These decisions do not always correspond to our tastes and we would like to move one of the objects a few millimeters to the left, or put it on top of another, unfortunately, that is not possible, what PlantUML decides is what you receive, period.
Postprocess
The ease of creating text-based charts has tons of applications, but as we said before, the results aren’t necessarily neat enough to put into a presentation for top executives. But PlantUML graphics have the option of being generated in PNG or SVG. We know that PNG is a format that describes the graphic in pixels, but not so SVG which uses a vector format, that is, it describes the lines, rectangles, circles, and texts that are in the graphic to be able to reproduce them in any dimension. I’d love for someone (maybe me in my spare time) to create a post-processing tool that could take an SVG generated by PlantUML and allow you to manipulate the objects to achieve the “pixel perfect” result that can be used in presentations.
Creative solutions
When PlantUML provides a less than satisfactory solution, one can always write their own solution by extending PlantUML. For example, PlantUML has something called wbs to describe hierarchies like an orgchart, but it’s too rigid and limited. For example,
@startwbs |
As you can see I don’t have much control over the direction and appearance of the branches (only the second level is aligned horizontally), although it is possible to change colors, but in general it is not flexible enough to use in real cases.
The good news is that if none of PlantUML’s diagram types work for you, you can always use GraphViz, the foundation on which PlantUML is built. For example, with a little bit of work I built a library that I can then use to create a much better looking orgchart:
@startuml |
One of PlantUML’s lesser-known features is its preprocessor. The graph above is built based on the preprocessor. Using an extra preprocessor function, %load_json, and posting the information for the orgchart somewhere in JSON format, then the above chart could be generated dynamically:
!include https://gitlab.migrandama.com/foss/plantuml-templates/-/raw/main/org-chart.puml
!$org_data = %load_json("https://migrandama.com/management/org_data")
!$managerColor="#503000"
digraph "org-chart" {
  rankdir="TB" splines="true" overlap="false" nodesep="0.2" ranksep="0.001" fontname="Arial" fontsize="9" style="rounded,filled" fillcolor="#ffffff" compound="true"
  edge [penwidth="3.0" color="#00000033" fontname="Arial" fontsize="9" dir=none ]
  node [color="#f09030" fontcolor="#503000"]
  officeEntity($org_data)
}
Assuming that the data served by the URL contains the same information that we used to create the orgchart above, this would be all the PlantUML code needed to generate the same chart, from then on, we would just need to keep the information updated in the json file, and the orgchart will always be fresh.
In conclusion
Why do I say that PlantUML is one of the most powerful and versatile tools in my repertoire? Well, because I use it in various activities of my life, and it almost always saves me a lot of time generating a text graph compared to what it would have taken me to draw, and that is not even considering all the time it would take to keep the drawing up to date when the information changes.
1 Microsoft insists on its closed versioning model that a) It only works if you turn it on, but anyone can turn it off and b) It doesn’t keep a secure history of who made which changes.